Google
 
Main Page
 The gatekeeper of reality is
 quantified imagination.

Stay notified when site changes by adding your email address:

Your Email:

Bookmark and Share
Email Notification
Project Graph [Go Back]
Purpose
The purpose of this page is to illuminate a somewhat older javascript graphing system to provide you with an easy alternative to using JQuery or another javascript framework in order to render a graph or chart with lines, points, and roll-over panes. If you are looking for symplicity, this is likely the solution to use since it is really easy to tailor most purposes.

This graph / charting system is able to render thousands of data points (such as X's, ellipses and triangle shapes). However, since javascript is client-side, it really comes down to the capabilities of the hardware system and web browser as to what the maximum may be.


(Enlarge)
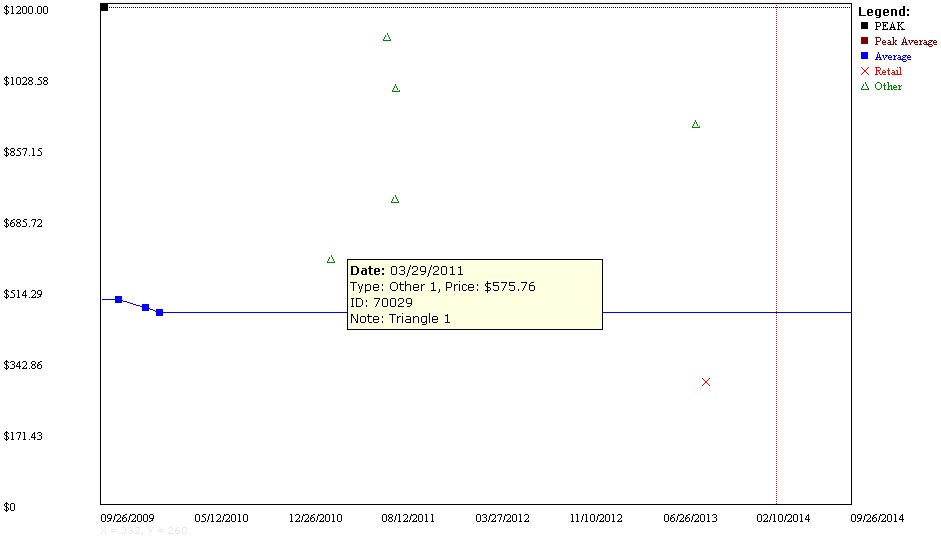
Using standard javascript and dhtml you can create price / stock graphs and charts without needing to introduce a large javascript framework.

You can download the example code here.
About Joe